Be Warned - Vanity Metrics: Road Map and Vanity Metrics
A few guidelines for Metrics
The metric is used by the team – Agile metrics should not be imposed or measured by management, they should be used voluntarily by agile teams to learn and improve.
The metric is surrounded by conversation – Metrics should not just be numbers, they should be the starting point of a conversation about process and roadblocks affecting the team.
The metric is part of a specific experiment – Metrics should be used to answer a specific question about agile processes, not just measured for the sake of measurement (Vanity Metrics)
The metric is used in tandem with other metrics – Even a great metric, if used alone, might lead to tunnel vision, and incentivise teams to maximize that metric at the expense of all else. Using several metrics together provides a balanced picture of agile activity.
The metric is easy to calculate and understand – Metrics that are overly complex or not fully understood, even if they provide good insights about a team’s work, are not useful in guiding day-to-day activities.
Here are a few ideas for you to consider
North Star Metric
Product success relies on measuring meaningful metrics – a north star. To define the north star – look at how your product delivers value to customers.
For most organisations, the north star metric is usually linked to customer engagement with your product.
It is
A single metric that best captures the core value that your product delivers to customers
Provides clarity and alignment on what the product team needs to be optimizing for and what can be traded off.
Most importantly, it holds the product accountable to an outcome. Examples include
Airbnb: Nights Booked.
Facebook: Daily Active Users.
Quora: Number of questions a user answers.
WhatsApp: Number of messages a user sends.
Escaped Defects

This is the number of bugs discovered after a build or release enters the production environment. The goal would be to get this as close as possible to zero.
Measuring escaped defects can provide a crude measure of deployed software quality.
If the number of escaped defects is high, it can generally come down to a few reasons including
The team is not working at a sustainable pace - they are rushing and hacking to try to get stuff done for some arbitrary deadline which results in reduced quality
Not addressing technical debt - building new functionality on top of unstable or poorly implemented code and not addressing underlining issues will result in more defects
Lack of investment in automated testing or using test-driven development approach - if a team doesn't invest in building unit tests, end to end tests etc then it will become difficult to handle regression testing when new code is added to the code base.
Support

Support Requests
Users might end up with requests which require product development teams to get involved e.g. importing large amounts of data.
Support requests require effort from teams so it’s important to measure this. If the team is constantly supporting one sort of request - it is probably best to work out a way to enable end-users to do this so in the future to free up the development team to work on something else.
If a support request comes into the development team because of an escaped defect, then it should be classed as an escaped defect.
Support Data
The other part of support is data from a help desk system. This can help provide quantified data to help with decisions for prioritisation about what to work on next. It can also help highlight areas of the system that may need work which could include
Fixing of bugs
Training for a particular feature
Worth looking at the UX design
No one using it - maybe needs marketing support to aid feature adoption

Lead and Cycle Time
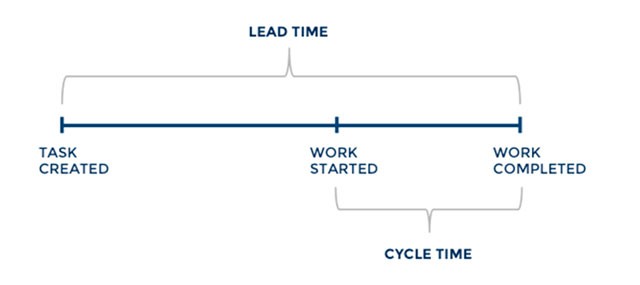
Lead time measures the total time from the moment a story enters the product backlog until it is completed and released to end-users. Some teams might even measure if from when something has added the roadmap.
It is designed to measure the total time for a requirement to be realised and start earning value. It measures the entire system from end to end and reducing the lead time should mean that the pipeline for creating and new delivering ideas is becoming more efficient.
Cycle Time
This is a section of the lead time, teams normally measure this from when something gets started on to when it is delivered. If this is very long or items in sprints are never delivered then you are not adding value for end-users.

Team Morale
From the agile principles, organisations should build projects around motivated individuals. Give them the environment and support they need, and trust them to get the job done.
One way to measure if a team is motivated is to check the teams moral.
The psychologist Verwijs suggests to measure team morale by asking team members to rate the following statements on the scale from 1 to 5 (or from 1 to 7, as it more nuanced):
I feel fit and strong in my team
I am proud of the work that I do for my team
I am enthusiastic about the work that I do for my team
I find the work that I do for my team of meaning and purpose

Turnover

Related to team morale, staff turn over provides a good indication if the team are happy, motivated and learning. People are more motivated when given autonomy and when engaged at work. The purpose is becoming more important for people than profit.
Employee turnover is calculated by dividing separations by the total staff: employee turnover = number of separations / average number of employees.
So if you lost 3 people in the past year out of a staff of 46, employee turnover = 3 separations / 46 employees = .0652 = 6.52% annual turnover.
If you had three staffers quit last month, and your total team is 46 employees, employee turnover = 3 separations in a month / 46 employees = .0652 = 6.52% monthly
Number of Experiments

In order for teams and products to improve, experiments need to happen.
Experiments also provide the team with variation and a break from the monotony of daily work.
From the agile principles teams should “At regular intervals, the team reflects on how to become more effective, then tunes and adjusts its behaviour accordingly.”
So what are examples of experiments
Trying a new tool for collaboration or to improve the way the team works or engage with users.
Working with customers or end-users to prototype
Trying a new way of working
Looking at some new technology - have a hackathon
Customer Satisfaction or Happiness
Many teams will use the Net Promoter Score (NPS), However, this can be considered a vanity metric
Net Promoter Score (NPS), calculated for a software release, measures whether users would recommend the software to others, do nothing, or recommend against using it. It is an important gauge of customer satisfaction.
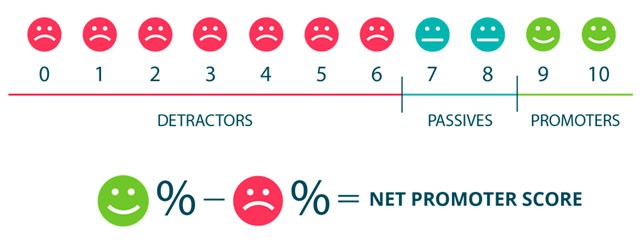
If customers are recommending this new release to others, that is a clear indication of success. If not, you can use this as a warning metric and use other data to understand what’s wrong.
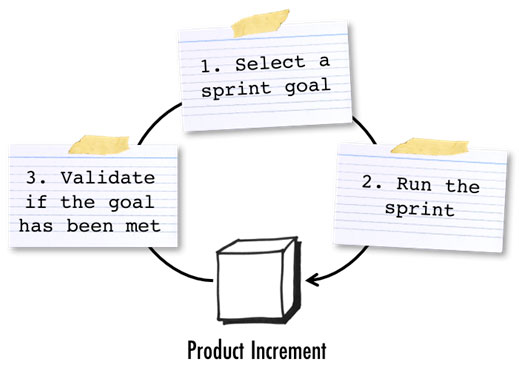
Sprint Goal
Should teams possibly look at how many times they hit the sprint goal or is this another vanity metric?
The sprint goal helps teams focus during the sprint and answers three questions:
Why are we carrying out the sprint?
How do we reach the sprint goal?
What metric tells us the goal has been met?
So why measure it? You will end up with a qualitative assessment of a scrum team’s work. Not just how many story points are completed, but how frequently the objectives of the business are met.
Maybe just a log of Smashed it of didn't quite smash it?
Team Health Check
Healthy teams will be able to work better together.
This is not talking about medical checks for team members its more about the environment they are working in and how they think they are working together.
This breaks down into multiple areas of the team e.g. culture, quality, learning…. and more and provide an outcome to show which areas are worse than others and where to focus on.
One suggested the approach is to give all the individuals cards to allow them to rate different areas of the team.

Each team individual can then decide how they feel on each topic. Topics could include

The outcome of the exercise will provide a grid, something like the below. This then gives you a clear visualisation to decide what to prioritise and focus on and try and improve until the next team health check is done again.

Timeline Roadmaps (Designed to Fail)

So this looks good?
Looks good today - your boss likes it. However, this actually sets teams and organisations up for failure. Why?
What is this showing? If you strip it back you have time and things to do, so you start adding the different features and in the short term it seems pretty simple and easy to use.

So you start adding your features…..

However, the more you add, the more you plan and the further out you go the harder it becomes to manage.

No matter what you do, everything you add to the roadmap always includes a time estimate and due date.
As a result, your roadmap is
A big pile of features
Loads of deadlines
All based on a set of assumptions
Assumptions
Using this type of roadmap means you are assuming the following
You know how long each feature will take
Perhaps this is easier in the short term as you have spoken to the team and lot’s of details have been discussed and you have some estimates but the further you go ahead in time, the less clarity you have.

Nothing else will come in
So no new ideas from customers, no market changes, no competitors release a feature you were going to release later and there is no need for iteration.

Everything will work once launched
So you have managed to build something in the time predicted, the next assumption is that what you built works in the exact way you expected, users accept it and there are no improvements to be made.

Features should actually exist!
By adding features to the timeline, you are assuming that these features should definitely exist are part of the strategy and should be built.

Nothing will change
Finally, your assuming.

What could go wrong?

So you added an item to the roadmap and it's been shown to important people who all now expect this to be completed around a certain time and you are assuming that when you start getting feedback on what you have built its what the user wanted.
So these made-up dates result in stressful “death marches” for teams who end up burnt out and quit trying to launch on time and the sales or marketing teams have these set expectations based on dates that you simply can’t meet.
What’s the opportunity cost, are you missing out on building something more relevant to the market or you users just because it was a feature already set on the roadmap put there 6 months ago.
Organisations
So this makes sense? So why do organisations struggle to adopt any of this?
So for product managers, can they drop their timeline-based roadmap and if not why not or what can be done?
Shareholders
Companies have to increase the money given to their shareholders and as a result, CEOs are pushed into showing a steady increase in growth or cost savings. As long as its going up, even if a small amount is better than nothing so, predictability is king!

How to get more predictability - well break up into smaller chunks but then your organisation ends up into silos, e.g. marketing, sales, R&D.

At this point, you might be wondering what any of this has to do with vanity metrics, well with each silo being measured and with pressure to show growth for shareholders and investors, what do you start to measure?
Vanity Metrics
Silos start leading in the dangerous world of vanity metrics, so each silo is competing with each other are under pressure to maximiser their metrics rather than collaborating for the good of the business.

Some areas of the business will be able to reach whatever their metrics are, but what are the knock-on effects, e.g. reduce the costs but the number of complaints increases

Profit vs Cost Centre
Each silo within the organisation is seen as a
Profit Centre - this is areas of the business where if they put investment into the silo, they should make some money e.g. an increase in revenue.

Cost Centre - this is areas of the business that need to exist but money spent here is going to be less than you get back.

Product development teams are found in cost centres
So the main issue for executives here is control, to reduce costs to have control so this leads to the way measurements are at the moment.
For Sales, the more money you put in here the more you are likely to get out and it can easily be measured by revenue, marketing can be measured with the return in investment and as result of these habits and cultures across silos, product teams end up getting measured in very similar ways.
The result is that product teams are measured using this old pattern, so measuring points and time e.g. velocity.

What is this actually measuring and what does it mean teams will do? This setup is optimised for trying to build as many features as fast as possible.
As a result, many teams suffer from burnout and you end up building an unstable product (tech debt)
Product Teams doing this are focused on output rather than outcome

However, measuring a teams velocity can give the product development silo costs which can be measured and give an easy way to tie the cost of development with what has been delivered and provide that predictability that organisations and CEOs love.
So it seems easy! If we want to deliver all these features then we just need to get a load of developers?

So we get a load of developers and we have all these features so we deliver a great product?

Oh an the team is burnt out, quits and there is a load of tech debt
What can be done!
The most common resistant to change is
My boss expects it - he/she won't change and has to have it this way!
Sales are relying on me - feature sold before it's even been built.
So sales and executives are passing the buck!
They are asking product development teams, mainly product managers to provide predictions when working with unpredictable and complex environments.
Product managers are given the impossible task of playing project managers on initiatives that are never given enough time for planning and trying to protect developers from having to try come up with super detailed waterfall type estimations and when things go wrong, the product teams get blamed.
So why are…
Items being sold when not built?
Why are these all-encompassing projects being done at all?
Why are things being asked for without allowing time for proper estimates
How to cope!
Other silos like sales, the Director has a sales pipeline and she won’t guarantee her 10 salespeople will provide 10 million and a fixed date but she does use the pipeline and a percentage likelihood - these are estimates rather than promises of exactly how much and when. This works and is accepted with organisations.
Marketing - “Half your advertising dollars goes to waste” - marketing is an experimentation engine and great marketing organisations are able to change their plans based on current events.
So in different areas of the organisation, they have found a way to get around uncertainty, what can the product teams do.
Consistent Growth
Why is it a trap? Everything looks good, we have smooth constant growth. Companies loose grip on the bigger picture, they become obsessed with the quarter on quarter, year on year growth and reducing costs of costs centres and maximising profits from the profit centre.
So by optimising for the short term, they leave behind the option to be flexible and solve new problems in the future. They often find themselves with other companies nipping at their heels e.g. startups vs 100s-year-old companies in banking.

The reality is every product gets to a point of maturity and the companies start plateauing and for the companies at the top of the plateau are only growing by a fraction of a percentage e.g. Walmart, Ford, Coca-Cola etc. Their base numbers are so big but are they looking around to see what other companies are nipping at their heels?

So the only way to break out of this habit is to experiment. However, for companies with poor product cultures and who like silos, this can be awkward, seen as costly, will the CEO take the risk, do they feel safe? - often companies are scared to take a risk and there are no incentives for innovation or change.

In the dip of the curve, CEOs start to sweat and get worried. However, look at where companies are. The table below shows a comparison of the largest companies in the world from 2008 to 2018.
With the exception of Exxon, the top companies are companies that are fasting moving and experiment.

If you look at stocks from the S&P, the top 500 performing stocks are shown by the black line at the bottom. The Netflix, Amazon and Google stocks are way above the other companies. These companies constantly deliver, iterate and move forward. They are performing better than the rest.

“All companies will go bust at some point, it's just a matter of when” so for these companies growing at 0.1% a year how do you be a Netflix in a world of blockbusters?

Blockbusters had many chances, they had people who wanted to change business models, they sore Netflix coming, they even passed the opportunity to purchase Netflix. The organisation would not take the risk, the excitive team were not prepared to take a drop in the predictable quarter on quarter small growth and we all know what happened to blockbusters.
Kodak is another example, they had the patents and tech for digital photos but they didn't dare to change their existing product lines and they were left behind when consumer habits changed.
Blackberry had its most profitable years in the two years after the iPhone was released however they didn’t react to changes in the market and their profits gave them a false sense of security and then when their numbers started to fall, they were too behind to catch up.
So, What can we do?
What can you do to make some change? This depends on the context of your starting point.
Does the company have the culture and mindset, do you buy-in from the top, are you an executive with influence, big/small company, do you have people, tools and tactics already place?

Culture
John Sumser - culture as calcification, culture is sediment layered over time so you can’t change the culture by just purchasing a table football. Culture is the patterns of behaviour, attitudes and ways of working brought to work each day by individuals as well as the history of attitudes.
Each company has a unique culture which is the product of its people, history and current context. Culture can change every day but it's built on sediment and calcification of existing culture.
So culture is not going to immediately change and you need to be careful with quick changes however, It can be changed through iteration and over time.

If you manage to chip away at old habits, you can change the culture and it's easier with executive buy-in. Even with a bottom-up approach, there are things you can try to change to change the direction of the company by changing the culture such as
Share different tools and tactics e.g. Hack-a-thons
Switch to a lean roadmap format for a month - see how the organisation copes
Share articles, links and tips in slack
Find other people like you and setup internal guilds
Do webinars to teach other people so it seems different scary
Lots of small exposure can change attitude over time, it provides interest and incentives for people to get re-trained and to allow the company to move faster and make better product decisions.
So how does this link to Metrics
Another way to change culture is to look at what metrics to have.
Move away from vanity metrics and start looking at metrics that will solve problems for the business, contribute to the longevity of the business and don't conflict with other departments in the organisation. One idea includes looking at OKRs to align teams around goals: Objective Key Results (OKRs) and tie them in with your roadmap.

Think about measuring how many experiments the team run rather than the number of story points the dev team can achieve. Measuring experiments change the mindset from delivery of features by date to allowing room for discovery and experimentation whilst still giving the executive team an idea of what they get for their investment. Executives want the smart team that has been hired to best they can to maximise their return on investment.
Another tip is when talking to executives, use their language
Talk about money - show them the money
Talk about risk - investment in the company is a risk if they don't invest in the right product areas
Talk about product portfolio like a hedge fund investors - don’t put everything in slow-moving shares but don’t put everything in startup stock.
Explore micro-investments e.g. google can invest 20% of their time in R&D, can you do 2%?
A lot of this remit is down to our product leaders - they need to talk to executives so they understand that good product investment can change an organisation so they become product lead.
People and Training
Whenever you can, invest in people and training as tools can be introduced but it’s better if the people have an understanding of why the tool exists and how it will help.
Product Culture
Product culture means people in the organisation
Are comfortable to share suggestions and speak up
They understand problems that are being solved across the business
They are not chasing or pitching vanity metrics
They are not conflicting or competing across
Are challenged and supporting

Product culture is a product itself, it can change and evolve as people changed, so culture changes day by day.
Product culture can be
Measured
Cultivated
Learned from
Iterated on
Improved on

Morning star Is a tomato processing company and responsible for 40% of tomato products in the US. It is the largest tomato processing company in the world and it has no managers!
From Laloux Cultural Model, Morning Star is an example of a Teal organisation - which have discovered how to work effectively without hierarchal structures
The Model comes from the book Reinventing Organisations. The model provides a clear picture of how culture may evolve in an organisation

In the book reinventing organisations, Frederic Laloux recounts the history of how people have worked together in organisations.
He proposed different paradigms, each with their own colour and characteristics.
A summary of each paradigm or perspectives is shown in the table below
Red | Amber | Orange | Green | Teal | |
|---|---|---|---|---|---|
Guiding Metaphor | Wolf Pack | Army | A machine | A Family | Living Systems |
Defining Characteristic | Powerful Leader | Strict Hierarchical Structure | Competition within and with other organisations, focus on financial profit and growth and objectives-based management | Delighting customers, making decisions based on a set of shared values and high engagement from everyone in the organisations. | Anti-Fragile organisational structures, alignment through and evolutional purpose and distributed decision making. |
Breakthrough Ideas | Command Authority and division of labour | Long term focus, Strong Processes, Formal Roles | Balancing the needs of all stakeholders, a focus on culture over strategy and true empowerment of members in the organisation regardless of their level. | Balancing the needs of all stakeholders, a focus on culture over strategy and true empowerment of members in the organisation regardless of their level. | Wholeness, Self Management and an Evolution Purpose |
Example organisations: | Mafia, street gangs and tribal militia | Public Schools (USA), Governments, Traditional Churches | Most Large Corporations and many Public Universities | Southwest Airlines and Ben & Jerries ice cream | Morning Star, Patagonia and Buurtzorg |
Limitation | Shortsightedness | When conditions change which require new approaches | When the profit motive is not fulfilling enough | Consensus building leads to slow decision making | ??? |
Paradigms / Perspectives
Red
The metaphor of the wolf pack is useful when describing the red paradigm as people would organise into tribes with a powerful leader who inspires fear with the group's enemies and compliance within the group. This paradigm is most useful in Chaos where the powerful leader might be the only reason the group survives.
The breakthrough ideas command authority where a leader sets a direction and people follow allowing them to work towards a common goal and the division of labour where people specialise in a specific type of work that benefits the overall group
The main limitation for red organisations is that they are shortsighted which is required to survive the chaos
Guiding Metaphor: Wolf Pack
Defining Characteristic: Powerful Leader
Breakthrough Ideas: Command Authority and division of labour
Example organisations: Mafia, street gangs and tribal militia
Limitation: Shortsightedness
Amber
These organisations evolved as organisations in Red which are fear-based were not able to have long term success.
Amber emerged as hierarchical patterns (Roman Army or Catholic Church) enabled the focus on long term goals which is only possible with stable leadership.
A strict hierarchical structure leads to stability and exerts control over lower levels of the hierarchy.
Guiding Metaphor: Army
Defining Characteristic: Strict Hierarchical Structure
Breakthrough Ideas: Long term focus, Strong Processes, Formal Roles
Example organisations: Public Schools (USA), Governments, Traditional Churches
Limitation: When conditions change which require new approaches
Orange
This paradigm evolved when Amber organisations were not able to adapt to changing conditions.
Orange emerged in the age of reason along with American and French revolutions, where individual meritocracy meant that the best ideas had a chance of competing regardless of an individuals status.
Most large organisations are in the orange paradigm and allow individuals to rise in the organisation based on their skills, intelligence and creativity.
The limitation of the orange paradigm is when people feel the profit motive is not fulfilling enough, often viewing themselves as a cog in the machine. A 2013 Gallop poll found that only 30% of US workers were engaged at work.
Guiding Metaphor: A machine
Defining Characteristic: Competition within and with other organisations, focus on financial profit and growth and objectives-based management
Breakthrough Ideas: Innovation, Accountability and Meritocracy
Example organisations: Most Large Corporations and many Public Universities
Limitation: When the profit motive is not fulfilling enough
Green
Green has emerged as people seek more meaning in their work. The Agile and lean movement emerged from companies with this perspective.
A part of the limitation is when consensus building leads to slow decision making and the hierarchy structures start to conflict with peoples desires to have more autonomy.
Guiding Metaphor: A Family
Defining Characteristic: Delighting customers, making decisions based on a set of shared values and high engagement from everyone in the organisations.
Breakthrough Ideas: Balancing the needs of all stakeholders, a focus on culture over strategy and true empowerment of members in the organisation regardless of their level.
Example organisations: Southwest Airlines and Ben & Jerries ice cream
Limitation: Consensus building leads to slow decision making
Teal
This level is emerging as organisations have discovered how to work effectively without hierarchal structures
Anti-fragile organisational structures which are either flat or based on interlocking circles of evolving roles aligning around and evolution purpose, making the world a better place.
Distributed decision-making authority uses the advice process where any colleague can make any decision in the organisation so long as they have considered the advice from anyone which the decision might impact.
The breakthrough idea of wholeness allows people to bring their whole selves to work; creative, spiritual and intellectual and they feel safe that they will not be judged for being themselves.
In most team organisations there are no managers and the purpose of the organisation is not owned by anyone person, it evolves as different people join the organisation and what the organisation learns about how to make a difference in the world.
Examples of teal organisations include Morning Star which is responsible for 40% of the tomato products in the US and Buurtzorg a 7,000 home care nursing organisation.
NB: More on Morning Star can be found here: https://hee-tis.atlassian.net/wiki/spaces/PS/blog/2019/08/05/1327595565/Morning+Star+s+Teal+Approach
Guiding Metaphor: Living Systems
Defining Characteristic: Anti-Fragile organisational structures, alignment through and evolutional purpose and distributed decision making.
Breakthrough Ideas: Wholeness, Self Management and an Evolution Purpose
Example organisations: Morning Star, Patagonia and Buurtzorg.
Limitation: ???
With Agile and Lean

Agile and Lean are rooted in the green paradigm and most of the struggles with adoption are in organisations whose leaders have an orange perspective.
For leadership in orange organisations, agile and lean are seen as process improvements to improve productivity, efficiency or profits.
However, without adopting the cultural perspective of green, only practices that align with orange are adopted and overlayed with orange approaches like top-down management.
Agile thrives in organisations with a green perspective. In a teal organisation, agile practices become almost overkill as the organisation has evolved with their own practices which include agile values.
How to move from Orange to Green?

Seek out other companies and individuals adopting the green paradigm and perspective, especially those in leadership positions and work with them to drive the cultural change required to make agile work as it was designs
From Laloux research, it indicates that only the top leader in an organisation can successfully transfer it vertically, for example from orange to green.

However, horizontal transformation is possible, for example working within the orange perspective to make it more vibrate place with innovation and objective-based management and away from micromanagement
Complexity
One colour might is not necessarily better than another, there are valuable ideas in each perspective
However, there is data that shows the newer perspectives are better at handling increasing levels of complexity and interconnectedness.
This does not mean every situation require this and it doesn't mean only green and teal organisations will be successful.

Newer perspectives also include older ones, so using the example of a Russian doll, so an organisation with a teal perspective can and should still use the orange or amber ideas when they might best meet the needs of the organisation.

Source