| Table of Contents |
|---|
| Warning |
|---|
Be Warned - Vanity Metrics: Road Map and Vanity Metrics |
...
A few guidelines for Metrics
...
Here are a few ideas for you to consider
...
North Star Metric
Product success relies on measuring meaningful metrics – a north star. To define the north star – look at how your product delivers value to customers.
For most organisations, the north star metric is usually linked to customer engagement with your product.
It is
A single metric that best captures the core value that your product delivers to customers
Provides clarity and alignment on what the product team needs to be optimizing for and what can be traded off.
Most importantly, it holds the product accountable to an outcome. Examples include
| Info |
|---|
Airbnb: Nights Booked. Facebook: Daily Active Users. Quora: Number of questions a user answers. WhatsApp: Number of messages a user sends. |
...
Escaped Defects
...
This is the number of bugs discovered after a build or release enters the production environment. The goal would be to get this as close as possible to zero.
...
The team is not working at a sustainable pace - they are rushing and hacking to try to get stuff done for some arbitrary deadline which results in reduced quality
Not addressing technical debt - building new functionality on top of unstable or poorly implemented code and not addressing underlining issues will result in more defects
Lack of investment in automated testing or using test-driven development approach - if a team doesn't invest in building unit tests, end to end tests etc then it will become difficult to handle regression testing when new code is added to the code base.
...
Support
...
...
Support Requests
Users might end up with requests which require product development teams to get involved e.g. importing large amounts of data.
...
If a support request comes into the development team because of an escaped defect, then it should be classed as an escaped defect.
Support Data
The other part of support is data from a help desk system. This can help provide quantified data to help with decisions for prioritisation about what to work on next. It can also help highlight areas of the system that may need work which could include
Fixing of bugs
Training for a particular feature
Worth looking at the UX design
No one using it - maybe needs marketing support to aid feature adoption
...
...
Lead and Cycle Time
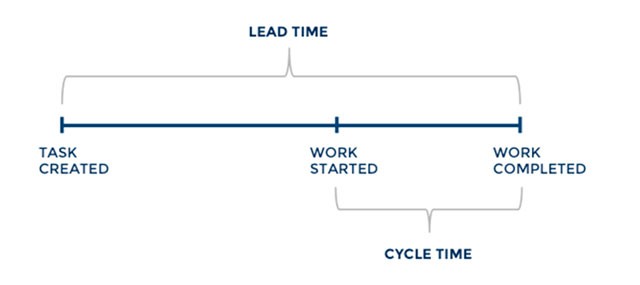
Lead time measures the total time from the moment a story enters the product backlog until it is completed and released to end-users. Some teams might even measure if from when something has added the roadmap.
...
Maybe just a log of Smashed it of didn't quite smash it?
...
Team Health Check
Healthy teams will be able to work better together.
This is not talking about medical checks for team members its more about the environment they are working in and how they think they are working together.
This breaks down into multiple areas of the team e.g. culture, quality, learning…. and more and provide an outcome to show which areas are worse than others and where to focus on.
One suggested the approach is to give all the individuals cards to allow them to rate different areas of the team.
...
Each team individual can then decide how they feel on each topic. Topics could include
...
The outcome of the exercise will provide a grid, something like the below. This then gives you a clear visualisation to decide what to prioritise and focus on and try and improve until the next team health check is done again.
...